CLASS 01
Conventional
125–180K
m³ capacity
The versatile backbone of the global LNG fleet.
View class profileMaritime energy knowledge platform
Explore structured educational content on LNG carriers, cargo containment, boil-off gas management, bunkering and floating LNG infrastructure — built for clear, source-aware learning.
BOG & Propulsion Economics Calculator
Educational scenario tool. Results are indicative and based on the assumptions you enter.
Educational LNG knowledge base. Technical content is reviewed and source status is shown where available.
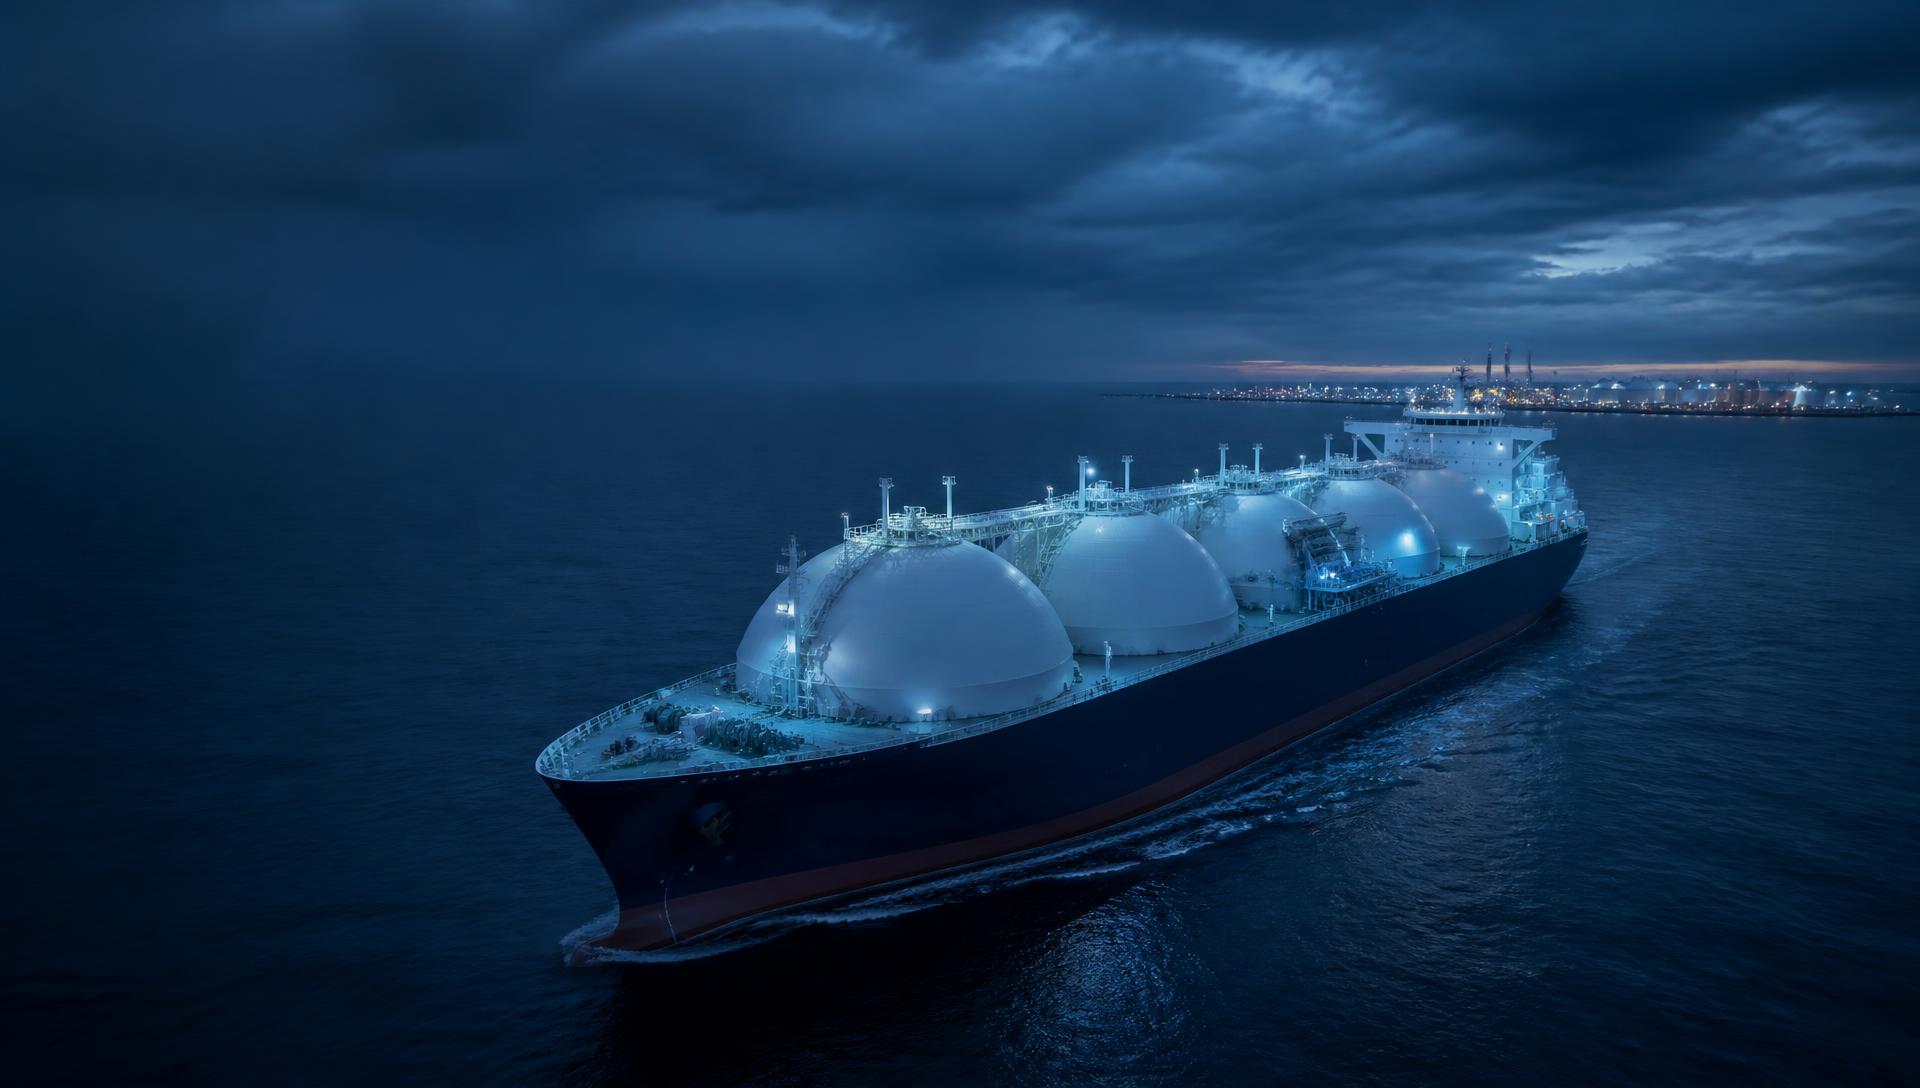
LNG carrier at sea · illustrative photograph
Cryogenic reference · educational values
Approximate liquefaction temperature at near-atmospheric pressure.
Approximate volume relation; depends on reference conditions and gas composition.
Composition varies by source and processing.
Indicative educational values explained in the glossary. Sources pending editorial review.
Conceptual diagram · boil-off gas pathways
Alternative ways boil-off gas may be handled. Availability depends on vessel design and operating mode; these routes are not all used at the same time.
Propulsion fuel
Boil-off gas can be burned in boilers or dual-fuel engines.
Reliquefaction
Where fitted, vapour is cooled back to liquid and returned to the cargo tanks.
Gas combustion unit
Equipment that safely burns surplus boil-off gas that cannot be used.
Knowledge pathways
Choose a structured entry point into LNG vessels, systems and terminology.
Explore LNG vessel types, operational roles and containment concepts.
ExploreUnderstand cargo systems, propulsion and boil-off gas management.
ExploreBuild confidence with clear definitions of essential maritime terms.
ExploreReview vessel categories side by side using educational attributes.
ExploreSystem architecture · end-to-end flow
From gas production and cryogenic liquefaction at approximately −162 °C, through marine transport on LNG carriers, to receiving terminals, regasification and downstream distribution.
Extracting natural gas from onshore or offshore fields.
Cooling natural gas to -162°C to liquid form.
Storing LNG in tanks and loading it onto carriers.
Transporting LNG across oceans in specialized vessels.
Warming LNG back into gaseous form at the destination.
Moving gas through high-pressure pipeline networks.
Delivering gas to end-users via local networks.
Utilization of gas for power, heat, and industry.
Process animation: “LNG Basic Process”
An external educational animation covering the same sequence. Playback starts only when you select play.
Vessel intelligence
Compare the carrier classes that define global LNG transportation—from flexible regional supply to maximum-volume ocean passage.
The versatile backbone of the global LNG fleet.
View class profileHigh-volume transport engineered for long-haul efficiency.
View class profileThe world’s largest LNG carrier class by capacity.
View class profileAgile distribution for regional and emerging markets.
View class profileInsights & analytics
A clear operational view of fleet growth, capacity, and vessel movement across the global LNG network.
Global LNG fleet capacity
Fleet by containment
Route activity
Schematic projection · corridors are indicative, not routed voyage tracks
Atlantic basin trade between Gulf of Mexico liquefaction terminals and Northwest European import terminals.
| Corridor | Indicative distance | Notable waterways |
|---|---|---|
| US Gulf Coast to Northwest Europe | approx. 4,500-5,200 nm | Florida Straits, North Atlantic weather routing |
| Middle East to East Asia | approx. 6,000-6,800 nm | Strait of Hormuz, Strait of Malacca, South China Sea |
| Australia to East Asia | approx. 3,300-4,200 nm | Indonesian archipelago passages, Luzon Strait |
| West Africa to Atlantic markets | approx. 3,400-4,000 nm | Gulf of Guinea approaches, Strait of Gibraltar |
| Arctic export routing (seasonal) | varies with ice routing | Kara Sea ice conditions, Bering Strait (eastbound legs) |
Operational benchmarks
Illustrative industry data for educational presentation.
OSSA on YouTube
Practical visual explainers on LNG carriers, systems and operations.
LNG fundamentals
Why watch
A visual starting point for understanding why LNG storage requires purpose-built cryogenic systems.
Select a topic to update the learning panel.
Now viewing: How Engineers Store the World’s Most Dangerous Liquid (LNG)
OSSA briefing
Monthly vessel intelligence and technical insights. No noise.